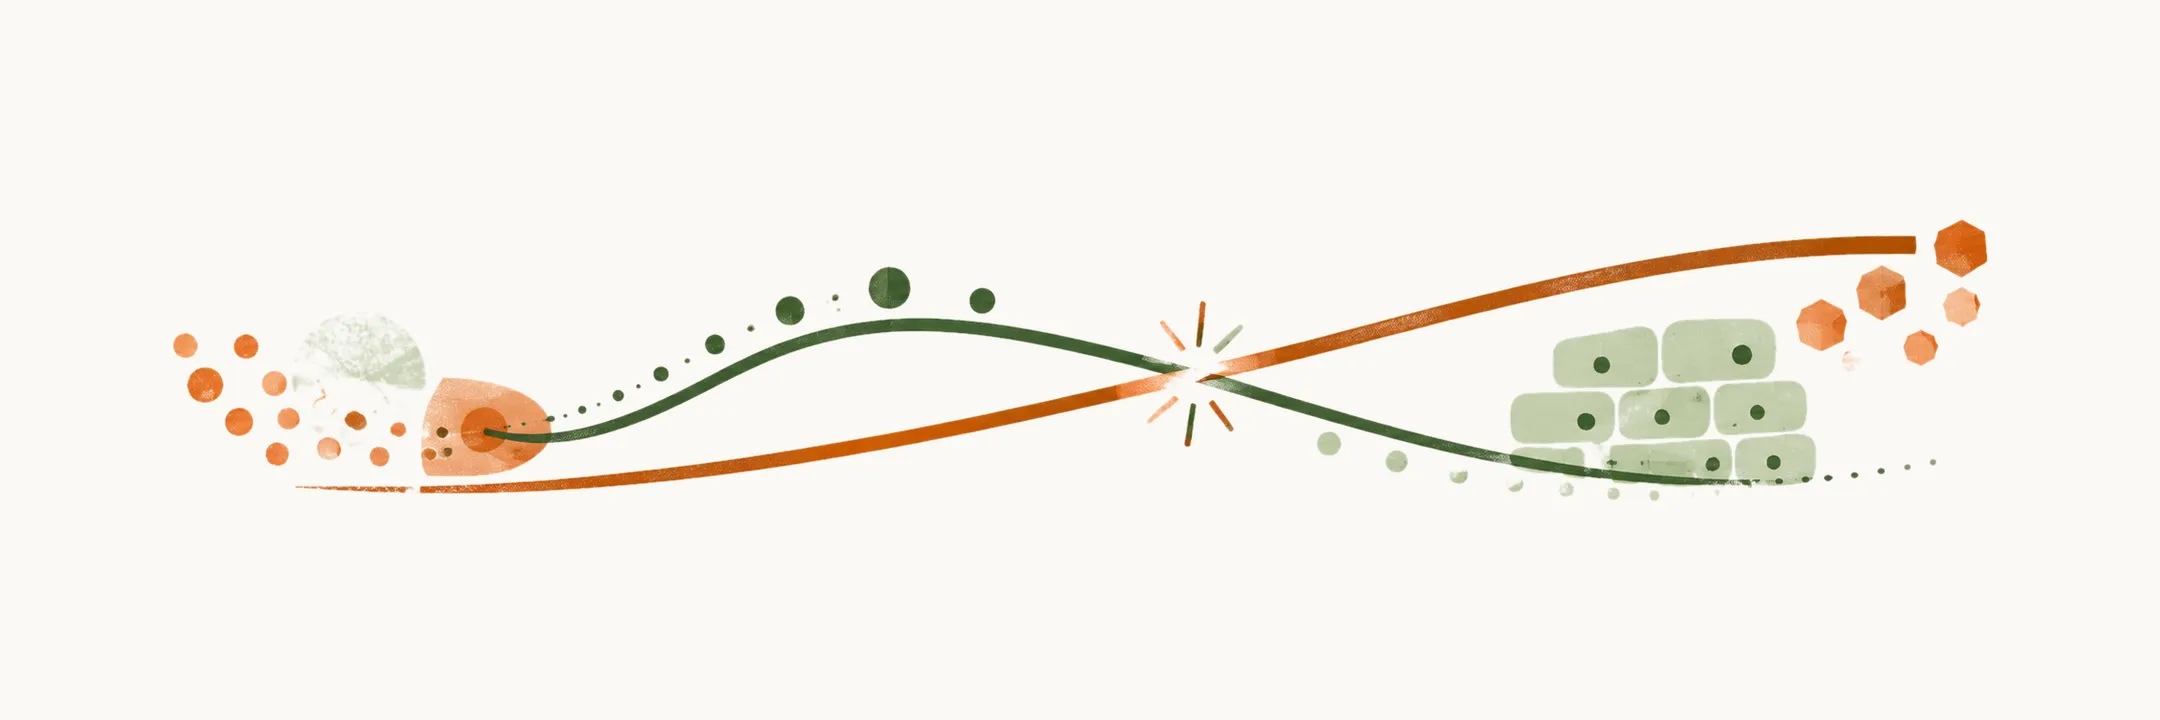
In type 2 diabetes mellitus (T2DM) the balance between insulin secretion and the sensitivity of tissues to insulin breaks down. Normal whole-body glucose homeostasis needs two things at once: a normal secretion response from the pancreatic β cells, and normal tissue sensitivity to insulin, reinforced by the way hyperinsulinemia and hyperglycemia themselves augment glucose uptake. When tissues stop responding, that reinforcement is lost.
Insulin resistance is defined by two changes: reduced peripheral glucose uptake, mainly in muscle cells, and increased endogenous glucose production (EGP), the glucose released into the blood by the body itself.
Adipocyte inflammation and insulin resistance of the adipocytes also contribute. The metabolic changes they set off — increased lipolysis, a raised free fatty acid (FFA) level, and increased intermediary lipid metabolites — reduce peripheral glucose uptake further, increase endogenous glucose production, and make the pancreatic β cells less sensitive to glucose.
Sites of insulin resistance in T2DM
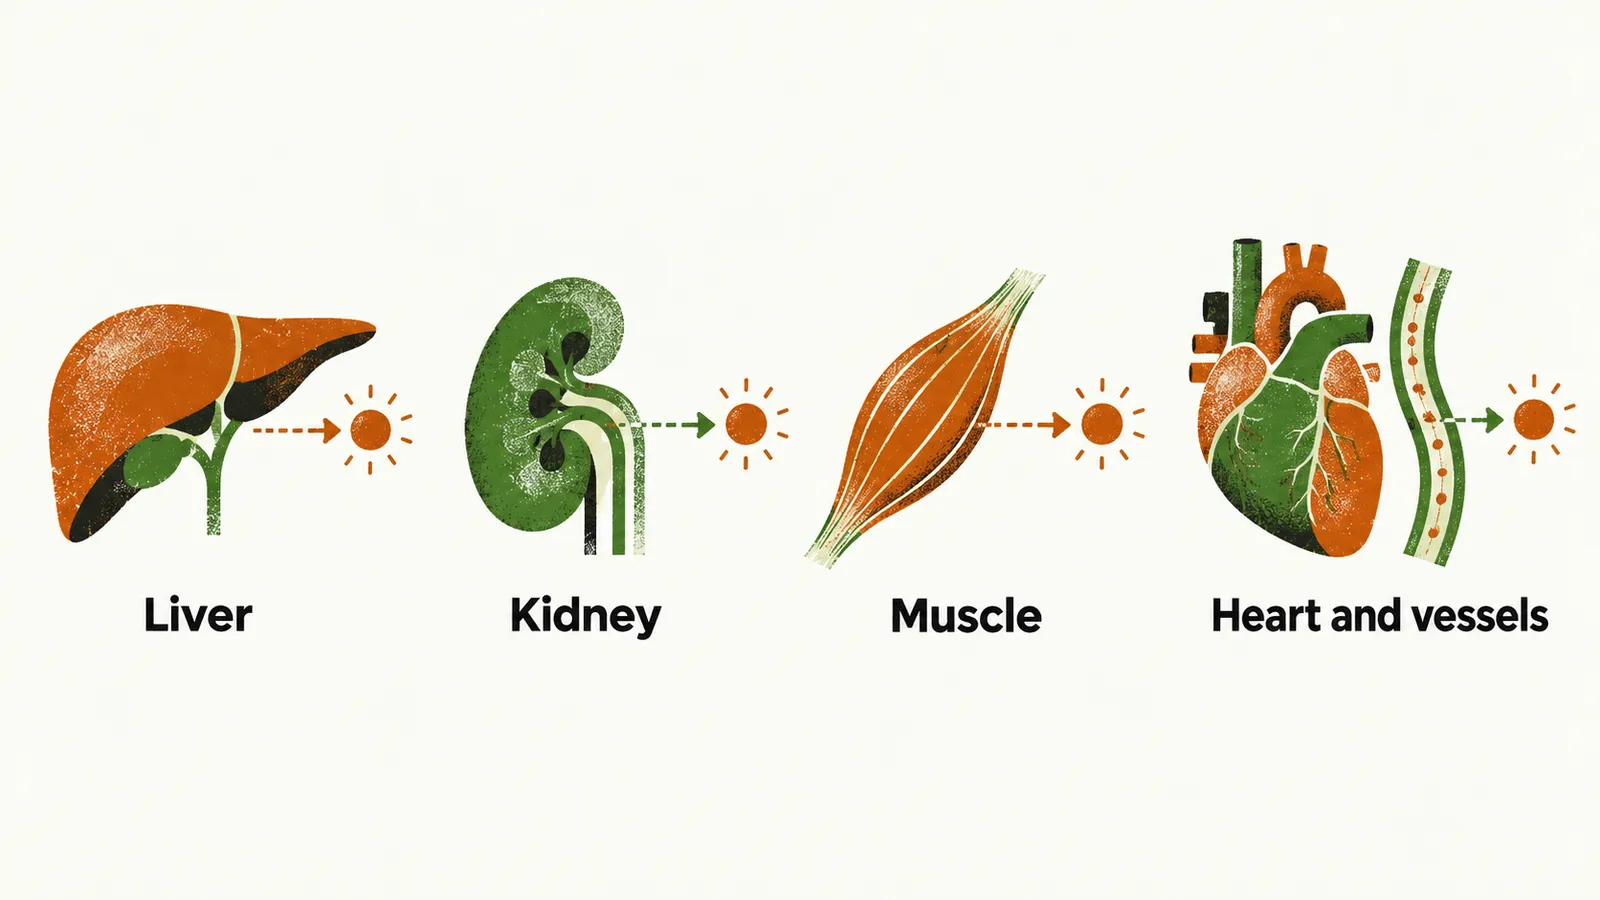
Insulin resistance affects four sites that handle glucose: the liver, the kidney, skeletal muscle, and the heart and vessels. In each, the question is how the tissue’s handling of glucose departs from normal.
Hepatic glucose uptake
Physiologically, glucose ingestion makes the pancreatic β cells secrete insulin into the portal vein, where it inhibits the liver’s basal endogenous glucose production and so prevents excessive hyperglycemia after a meal. In patients with T2DM the hepatic cells are insulin-resistant, that inhibition is lost, and glucose rises markedly after eating because the liver’s EGP is not suppressed by the hyperinsulinemia.
The size of that failure can be measured. In patients with T2DM and mild-to-moderate fasting hyperglycemia, defined as 140–200 mg/dL of glucose, EGP during night sleep is excessive at about 2.5 mg/kg.min instead of the normal 2 mg/kg.min, enough to add about 35 g of glucose in an 80 kg individual by morning. The dose–response relation between suppression of EGP and plasma insulin concentration is very steep: only 30–40 µU/mL of insulin is enough to halve EGP, while the high physiological normal level of about 100 µU/mL suppresses it fully. Early on, therefore, EGP is completely suppressible, and only as insulin resistance advances does that reserve stop compensating. More than 90% of post-absorptive EGP is devoted to gluconeogenesis, the synthesis of new glucose in the liver. Resistance of insulin receptors in the CNS, especially in the third ventricle and hypothalamus, also increases EGP, so central insulin resistance contributes to fasting hyperglycemia.
Kidney
Different studies propose different values for the kidney’s contribution to EGP, between 5% and 20%. A possible mal-adaptation has been described in which the tubular cells increase expression of the SGLT2 transporter, the carrier that reabsorbs glucose from the filtrate; a higher reabsorption threshold in T2DM would then contribute to sustained hyperglycemia. This hypothesis is not yet firmly supported by studies.
Muscle glucose uptake
In the euglycemic hyperinsulinemic state in normal subjects — insulin infused while glucose is held steady, so that glucose disposal can be measured — more than 80% of the glucose is disposed of into peripheral muscle tissue. The rate of glucose uptake by muscle increases linearly as plasma insulin rises. In patients with T2DM, muscle uptake of glucose is severely decreased.
Vascular and myocardial insulin resistance
Physiologically, myocardial cells take 60–70% of their fuel as FFA and about 30–40% as glucose; just after a meal the balance shifts toward glucose, which then supplies 70% of the energy the myocardium needs. In patients with T2DM the raised circulating FFA causes insulin resistance in myocardial cells and reduces their ability to take up glucose from the circulation. The combination of that insulin resistance and the accumulation of lipid pools inside the myocardial cells lowers tolerance to ischemia and brings cardiovascular complications earlier.
Quantifying insulin resistance and the failure of insulin secretion
The insulin resistance of T2DM reduces glucose uptake after glucose ingestion. The normal rate of whole-body glucose uptake with intravenous glucose is about 7 mg/kg.min; in T2DM patients it is reduced by 2.5 mg/kg.min, mainly because of the insulin resistance of muscle tissue.
As in normal glucose homeostasis, the oral and intravenous routes differ. After oral glucose, peripheral tissue takes up less of the load, about 45%, and the suppression of EGP is incomplete, at only 50%. Two of these changes account for the hyperglycemia of T2DM after a meal:
- lesser muscle tissue uptake of oral glucose — two-thirds of the hyperglycemia after oral glucose in T2DM is due to abnormal muscle tissue uptake
- lesser suppression of EGP after oral glucose — one-third is due to the lesser suppression of EGP
Taken together, the main mechanism behind post-absorptive (fasting) hyperglycemia is liver insulin resistance, and behind post-prandial (after-meal) hyperglycemia it is both liver insulin resistance, which fails to suppress EGP, and muscle insulin resistance, which fails to take up the majority of the glucose absorbed.
Metabolic dysfunction-associated steatotic liver disease, formerly called non-alcoholic fatty liver disease, is now recognised to play an important role in insulin resistance.
T2DM is a heterogeneous disease, and several hypotheses have been proposed for its pathogenesis. The best proven is β-cell dysfunction, in which the β cells themselves can no longer mount the secretion needed. A second, less proven, is hyperinsulinemic desensitization: observations in animal models and in patients with insulinoma show that a persistently high insulin level reduces tissue sensitivity, and that this can progress to full resistance. A third is delayed insulin clearance; some studies show that slowing the removal of insulin is a compensatory response to insulin resistance and β-cell stress, but the evidence is not sufficient to treat it as a cause or driver of T2DM. The fourth is nutrient toxicity: constant and higher exposure of β cells to glucose and other nutrients increases oxidative stress in the β cells, especially in the endoplasmic reticulum and mitochondria, which damages the cells and impairs insulin secretion.
Dynamic studies of insulin secretion and tissue sensitivity, using euglycemic insulin clamp tests in obese and lean patients with T2DM and in healthy subjects, show a striking pattern. Obese patients without T2DM have the same insulin resistance as lean individuals with T2DM, yet the obese non-diabetic subjects have neither impaired glucose tolerance nor morning hyperglycemia. The paradox resolves in the β cells: patients with T2DM cannot increase insulin production enough to compensate for their insulin resistance, and that shortfall produces the overt diabetic picture of morning hyperglycemia and low glucose tolerance.
This gives the practical definition of insulin resistance: a normal glycemic state can be maintained only by a high — indeed overt — secretion of insulin, so a high insulin level is what is needed to hold glucose down. Because the requirement is a rate of insulin secretion relative to the resistance, not an absolute insulin level, it has to be quantified. One index proposed for this is the disposal index, also called the insulin secretion/insulin resistance index, calculated by dividing the amount of insulin secreted in response to a rise in glucose by the patient’s insulin resistance. The relation between the disposal index and 2-hour plasma glucose is logarithmic: patients with T2DM sit at a lower disposal index with a hyperglycemic condition, which means their insulin secretion is not sufficient to dispose of enough glucose into the peripheral tissues.
Natural history
The natural history carries the central message of the disease. At the first stages of diabetogenesis, insulin sensitivity falls, but it is compensated by the high capacity of the pancreatic β cells to produce insulin. Overt T2DM appears only once that compensatory secretion no longer keeps pace with the resistance. What sets the resistance in motion, and how fat tissue takes part in it, remains to be explained.